|
HAMS-GPS Quantitative Risk Assessment Software FAR, FN-Curve, ISO-Risk, Individual Risk computations, Risk levels |
 |
|||||||||||||||
|
||||||||||||||||
|
HAMS-GPS Quantitative Risk Assessment Software FAR, FN-Curve, ISO-Risk, Individual Risk computations, Risk levels |
|
|||||||||||||||
|
||||||||||||||||
|
Snapshots of advanced QRA software |
|
|
Accidental release of hazardous chemicals |
|
Software
validation done by our client A QRA (Quantitative Risk Assessment) study is a systematic, data-driven process to quantify the probability and consequences of hazardous incidents in industrial settings, identifying potential failures, assessing their likelihood and impact on people, assets, and the environment. The steps involve hazard identification (like HAZID or HAZOP), scenario selection, frequency and consequence modeling, risk estimation, and implementing mitigation measures to achieve an Acceptable Level of Risk, often guided by the ALARP principle. 1. Hazard Identification: Identifying potential sources of risk, often using techniques like HAZID (Hazard Identification) or HAZOP (Hazard and Operability Study). |
elp on how to do BLEVE simulations
BLEVE
(Boiling Liquid Expanding Vapour Explosion) scenarios
If Liquid is flammable flashing liquid or flammable liquid:
BLEVE
scenarios Under
explosion scenario options
Under fire scenario options
If Liquid is non-flammable
Mechanical
Explosion scenario Under
explosion scenario options
Graphics
mapping are in colour
|
|
Watch QRA software package Demo on YouTube |
Download
or view demo videos HD quality use Google chrome browser. |
|
|
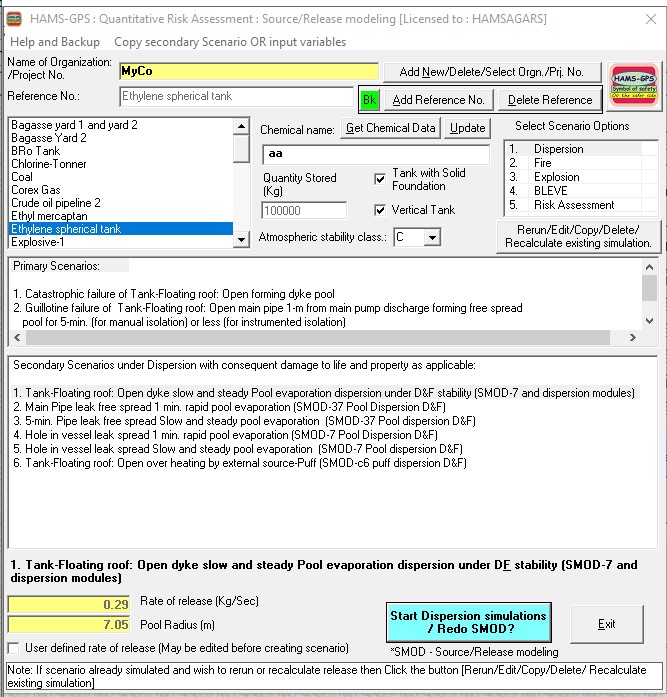
5. Calculate rate of accidental release of hazardous chemical |
|
|
|
Window showing Maximum Credible Accident / Loss Scenarios (MCAS / MCLS) and Release/Source Now with option for user defined rate of release. |
|
|
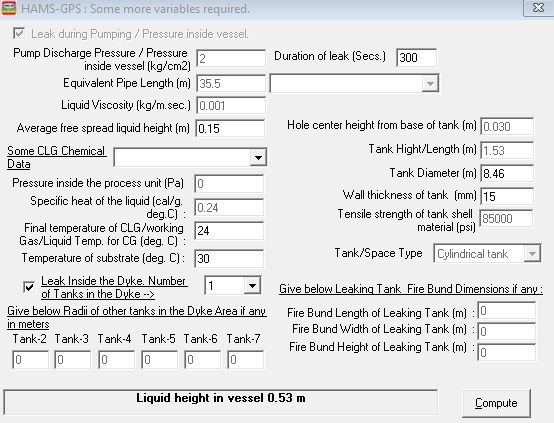
Additional data requirement window
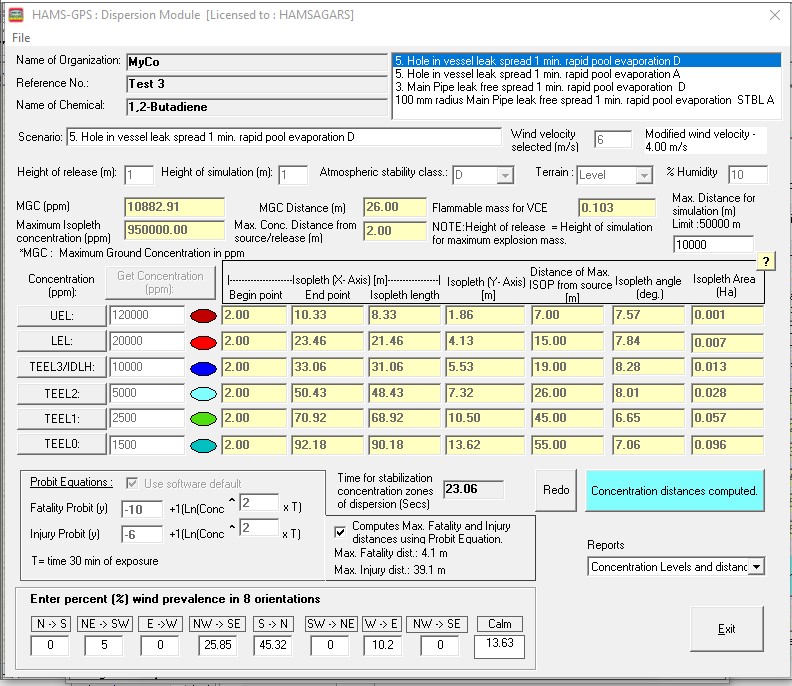 |
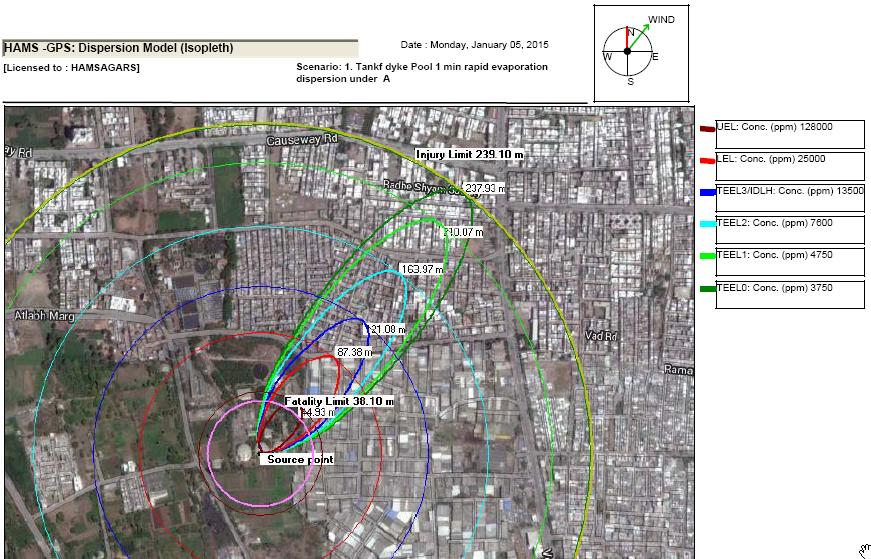
Dispersion modeling window showing hazard distances
|
|
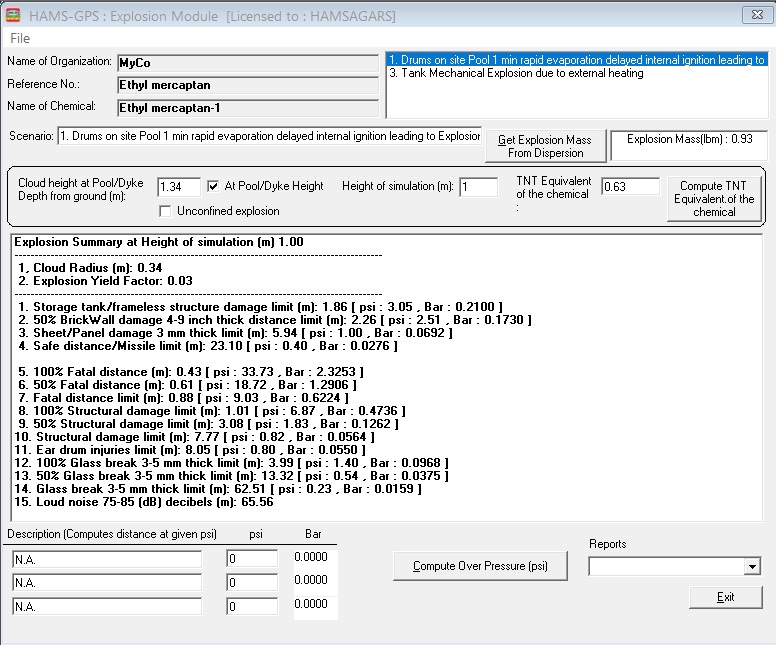
Explosion modeling window showing hazard distances
|
|
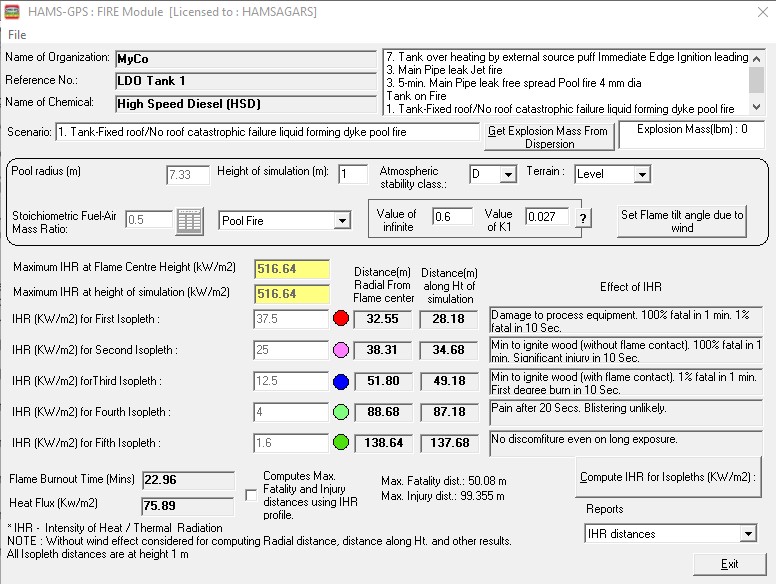
Fire modeling window showing hazard distances
(Pool Fire, Jet fire, Tank Fire, Flash fire, Fireball... )
|
|
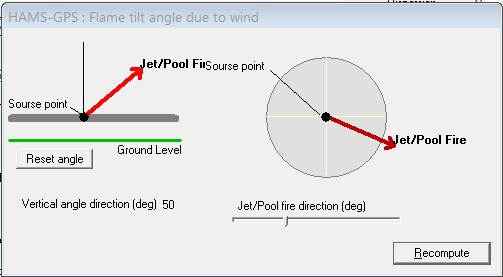
window showing Jet fire tilt angle due to wind and direction
|
|
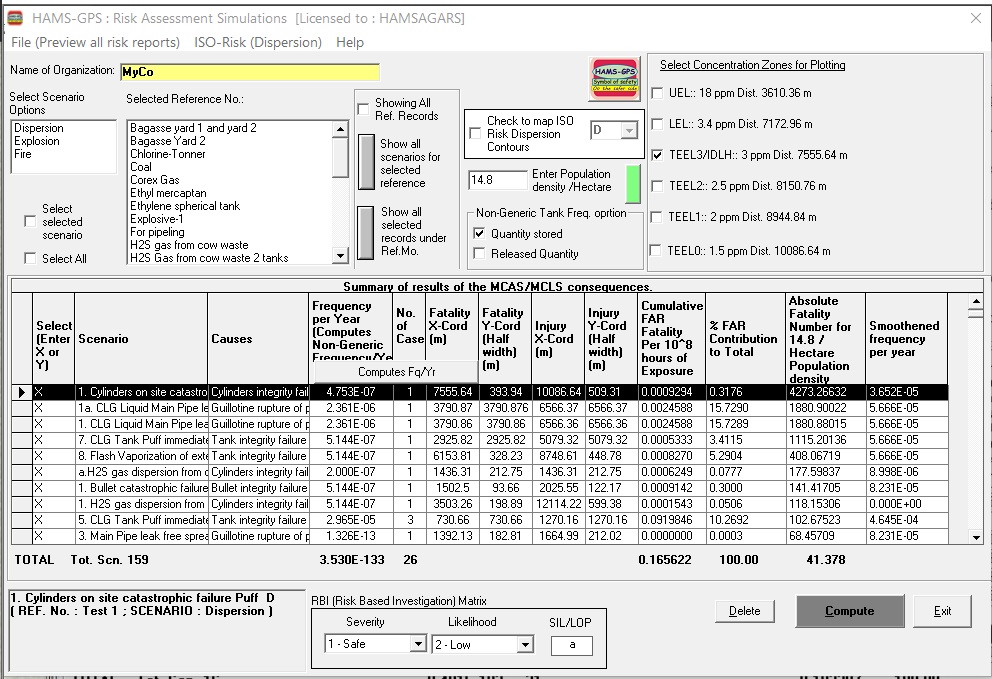
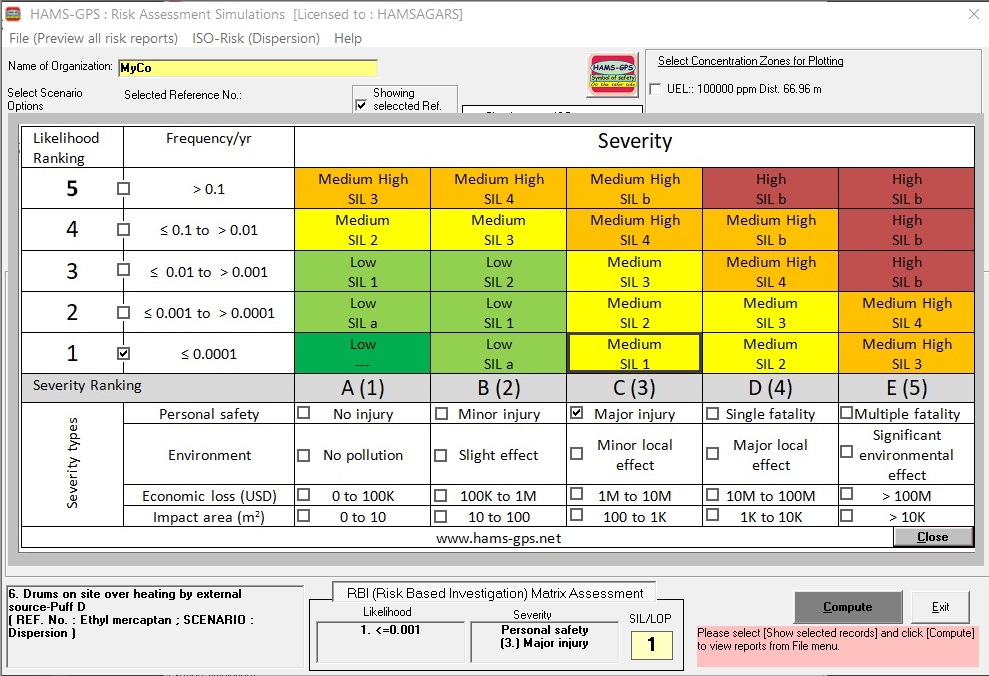
Risk analysis modeling window
|
RBI Matrix assessment window
|
|
Showing various mapping options and settings window
|
|
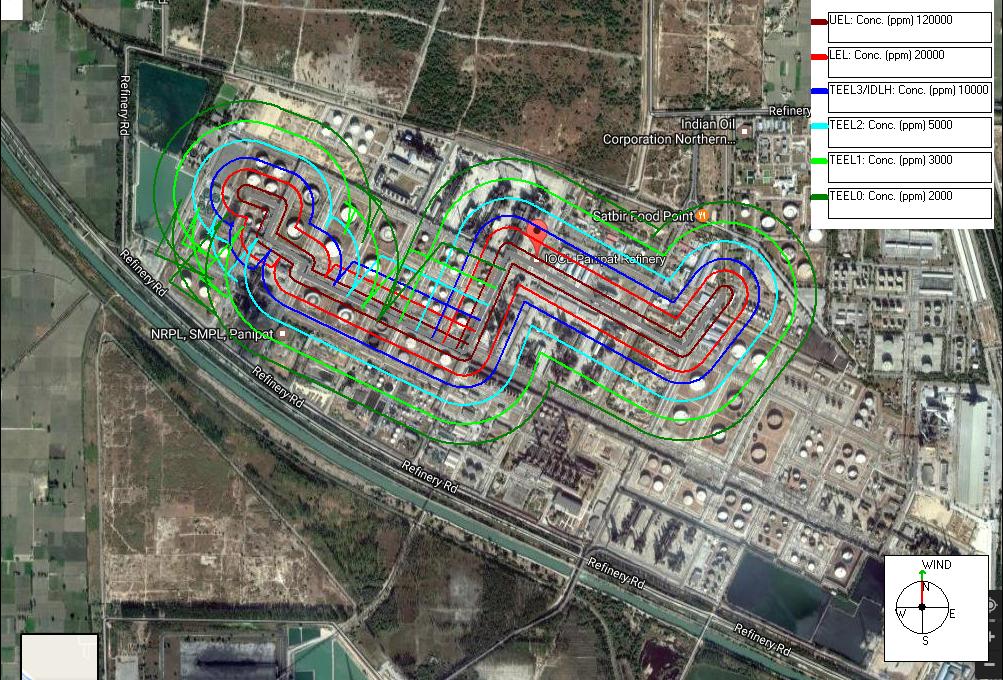
Mapping of Hazard zone on picture - Google map
|
|
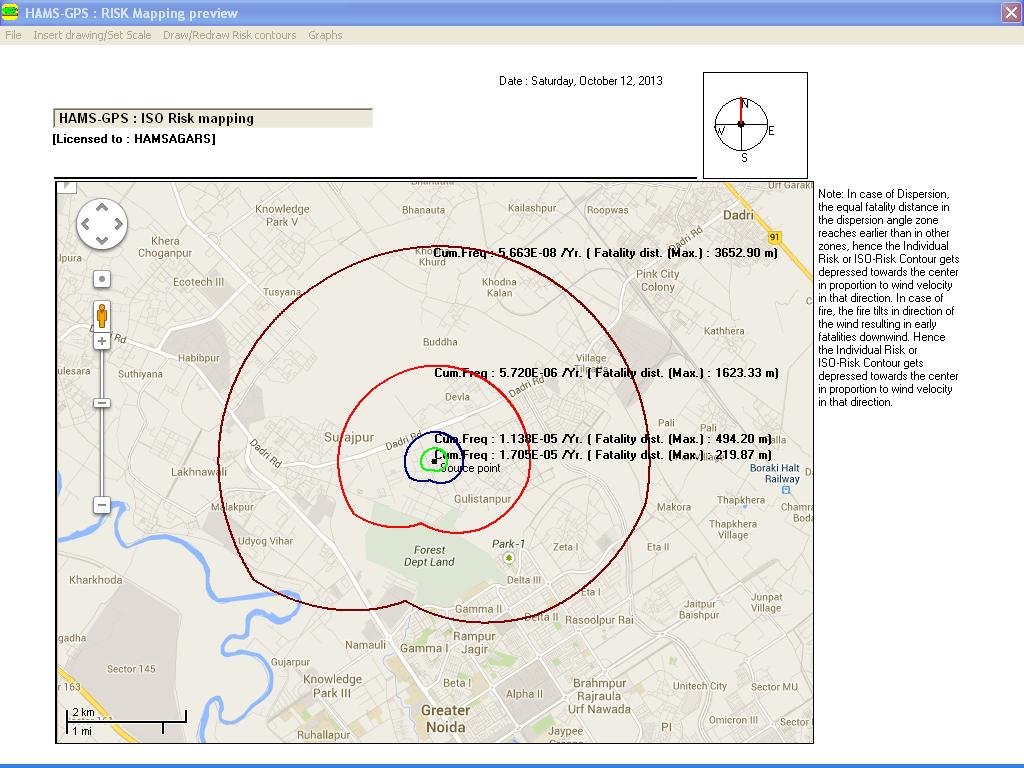
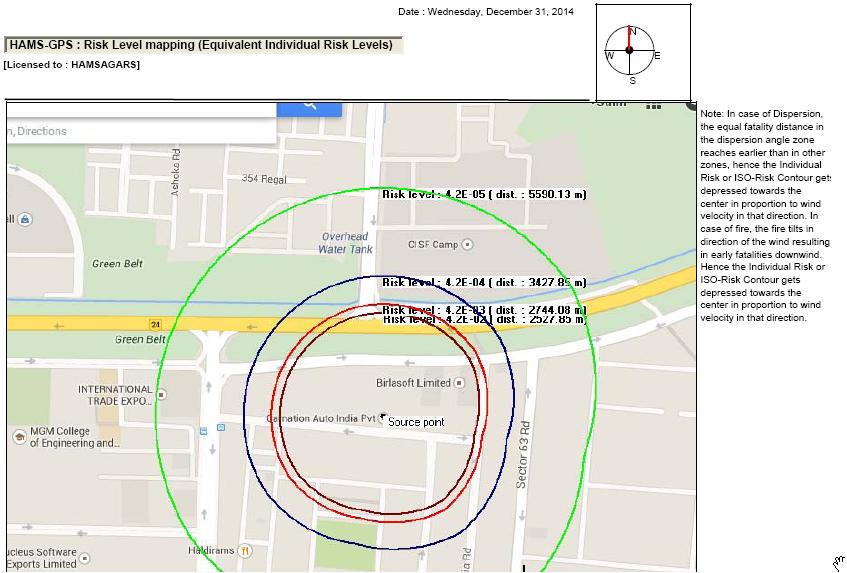
Mapping of ISO Risk, Societal Risk, Individual risk levels on picture - Google map
|
|
Mapping of risk level on google map
|
|
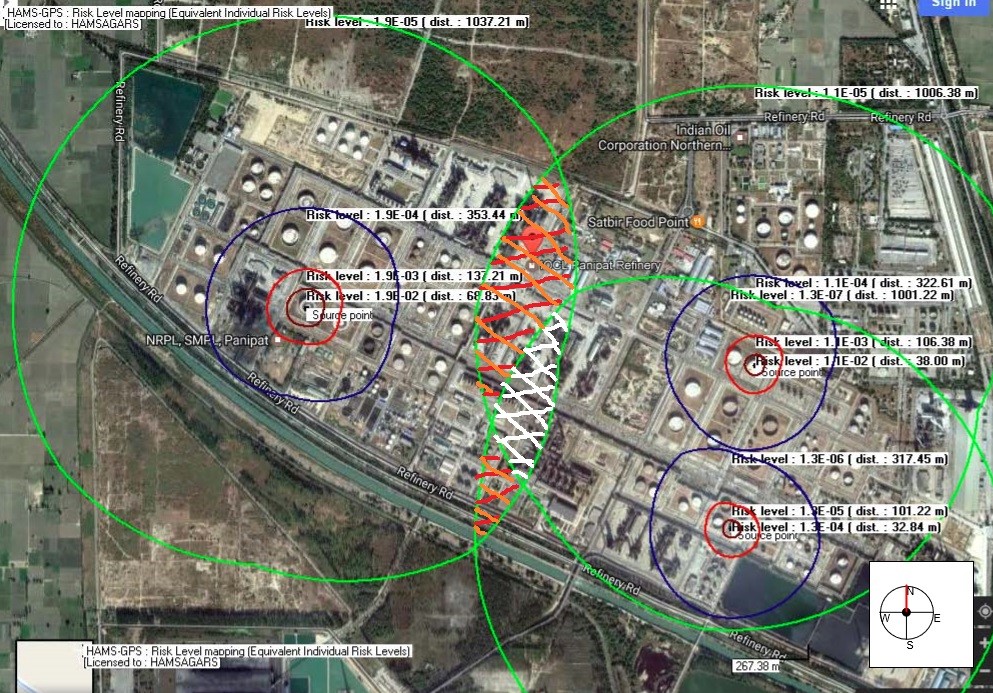
Mapping of multiple release points of risk level on google map
|
|
ISO Risk levels two different sets of scenarios different locations and overlapping of ISO risk contours.
|
|
Mapping of Hazard zone along Pipeline (this capability will be released soon)
![]()
![]()